In our data-driven age, the mastery of data comprehension and communication is crucial. Data visualization stands at the forefront of this challenge, serving as a pivotal tool in transforming complex datasets into clear, understandable visuals. This guide explores the multifaceted elements of data visualization, illustrating how it revolutionizes the way we analyze, present, and utilize data for strategic advantage.
The Essence of Data Visualization
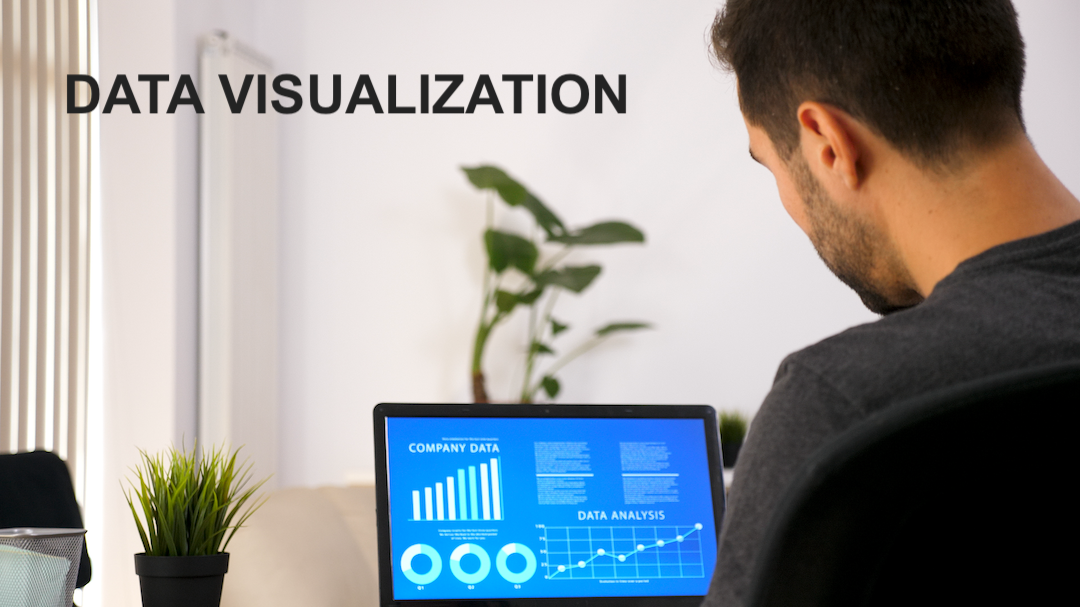
At its core, data visualization is an intricate blend of techniques and tools designed for the visual representation of data. This approach converts intricate data sets into more accessible and comprehensible formats, bridging the gap between complex information and its practical application. It's more than just presenting numbers and stats; it's about telling a story that resonates with your audience, making data not just seen, but understood. Data visualization is often depicted in dashboards.
Discovering Insights through Data Exploration
Data visualization shines a light in the depths of datasets, revealing hidden patterns and insights crucial for informed decision-making. By visually exploring data, you uncover trends and anomalies that might go unnoticed in traditional analysis methods. This exploration is not just about viewing data; it's about understanding and interpreting it, providing a solid foundation for strategic planning and informed decision-making.
Amplifying Data Presentation and Communication
Data visualization plays a crucial role in effectively communicating your data findings to employees or investors, as it translates complex data into easily understandable visual formats. By using visually engaging charts and graphs, you can highlight key insights and trends that might otherwise be overlooked in raw data. When sharing and printing these visualizations, it's often necessary to convert files to images hassle-free, especially from PDFs to JPGs. This is where a PDF-to-JPG converter becomes invaluable, allowing you to extract and isolate graphics from PDF documents while maintaining the image's quality.
Benchmarking Performance Using Visuals
Data visualization is a powerful tool for benchmarking. It allows you to visually compare your performance against industry standards, competitors, or past data. These comparisons provide a visual context for your performance, highlighting areas of strength and opportunities for improvement. This visual benchmarking acts as a compass, guiding strategic decisions and fostering growth.
Boosting Sales with Data-Driven Visuals
In the realm of sales, data visualization is invaluable. It provides actionable insights into customer behavior, market trends, and product performance. By visualizing this data, you gain a deeper understanding of what drives sales, enabling you to tailor your strategies to meet market demands and consumer preferences effectively.
ROI Analysis Through Visual Interpretation
Data visualization plays a crucial role in ROI analysis. It provides a clear and precise visual representation of your investments' returns, simplifying complex financial data into understandable formats. This clarity in financial analysis is crucial for evaluating the effectiveness of your investments and strategizing future financial decisions.
Segmenting Customers with Visual Data Techniques
Understanding your customer base is essential, and data visualization aids in this endeavor. By visually segmenting customers, you can tailor marketing efforts, create personalized experiences, and improve retention strategies. This segmentation is not just about grouping customers; it's about understanding their unique preferences and behaviors, allowing for more targeted and effective engagement.
Conclusion
Data visualization is more than a trendy concept; it's a vital tool that empowers businesses to make data-driven decisions, enhance performance, boost sales, and forge stronger customer relationships. By embracing the power of data visualization, you gain a competitive edge in today's data-centric landscape, turning raw data into a strategic asset. This guide serves as your roadmap to leveraging the full potential of data visualization, ensuring your data works for you in ways never imagined before.
Share this post
Author

Read the latest articles from Bella Reilly

February 9, 2024
How to Lay a Foundation for Consistent Business Growth
Growth is an objective and a necessity for survival and success in the fast-paced and ever-evolving business landscape. Entrepreneurs and business leaders must be equipped with dynamic strategies to navigate this challenging environment. This article presents essential methodologies and approaches to lay a robust [...]
Learn more
December 9, 2023
Essential Cybersecurity Insights for Aspiring Entrepreneurs and Business Owners
In the realm of business, cybersecurity emerges as a cornerstone of success. Your journey as an aspiring entrepreneur or a business owner demands a deep understanding and implementation of robust cybersecurity strategies. This guide serves as a beacon, illuminating the path to a secure business environment.
Learn moreLeave a comment
All comments are moderated. Spammy and bot submitted comments are deleted. Please submit the comments that are helpful to others, and we'll approve your comments. A comment that includes outbound link will only be approved if the content is relevant to the topic, and has some value to our readers.
Comments (0)
No comment